For School Students & Beginners

Learn to Code. Talk to Data. Build Real AI.

0 Modules

Beginner Bootcamp

0+

Python Scripts

0 Projects

Real-World Apps

The Basics

How Data and Python Create AI

Before we write code, we need to understand the relationship between Data, Python, and AI. Think of it like cooking.

๐Ÿ“Š

The Ingredients (Data)

Raw facts like images of dogs, weather numbers, or game scores.

โš™๏ธ

The Recipe (Algorithm)

A set of step-by-step math rules that tell the computer how to find patterns.

๐Ÿค–

The Chef (AI)

The final "Smart System" that can predict the future after learning the recipe.

The Learning Process

How a Machine Actually Learns

Itโ€™s not magicโ€”it's a 4-step loop that computers repeat millions of times.

๐Ÿ‘€

1. Look

Computer looks at the data (e.g., an image of a cat).

๐Ÿค”

2. Guess

It makes a guess: "I think this is a dog."

๐Ÿ“

3. Measure

A "Teacher" code says: "Wrong! You were 80% incorrect."

๐Ÿ”„

4. Adjust

The computer changes its internal math to be closer next time.

๐Ÿค– Algorithm vs. Machine Learning: What's the difference?

An Algorithm is like a simple Instruction Manual (If A, then B). Machine Learning is when the computer writes its own manual by looking at data!

Science Focus

Bio-Neuron vs. Digital Neuron

How does a human brain compare to an AI "Brain"? Let's find out!
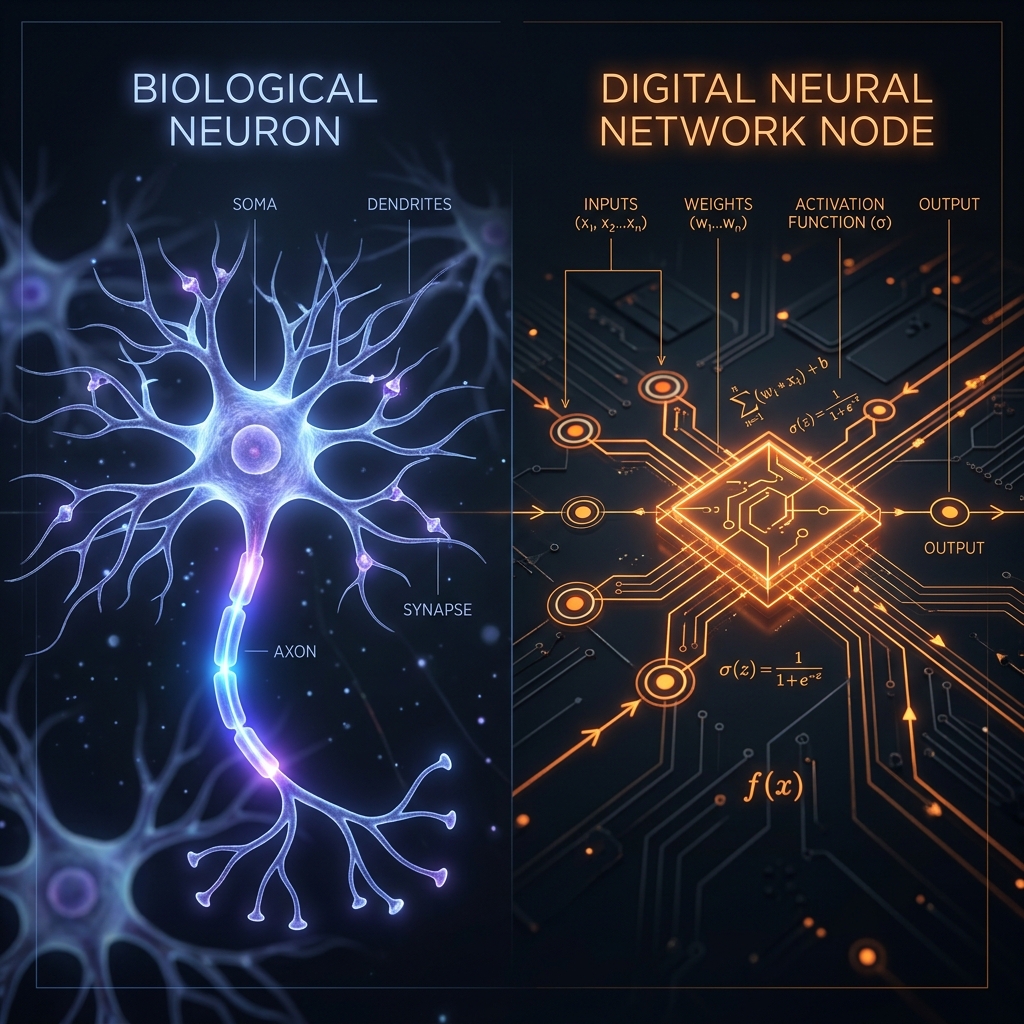
Neuron Comparison

The Human Neuron (Biological)

Your brain is made of billions of tiny cells called Neurons. They talk to each other using electricity and chemicals.

  • ๐Ÿง  Dendrites: Receive signals from friends.
  • ๐Ÿงฌ Cell Body: Decides if the signal is important.
  • โšก Axon: Sends the signal to the next neuron.
Fun Fact: Your brain is the most energy-efficient computer. It runs on just 20 Wattsโ€”less than a lightbulb!

The AI Neuron (Digital)

AI "Neural Networks" are math versions of your brain. They use numbers instead of chemicals.

  • ๐Ÿ“ฅ Inputs: Raw data (like pixel colors).
  • โš–๏ธ Weights: Importance given to each input.
  • ๐Ÿ“ˆ Activation: A math rule (like ReLU) to decide the output.
Fun Fact: While you learn from a few examples, AI might need 1,000,000 pictures of a cat to recognize one!

Main Differences

Speed

AI is millions of times faster at calculating math.

Creativity

Humans can invent new things from nothing. AI needs data.

Hardware

Humans = Water & Proteins.
AI = Silicon & Electricity.

Important Words You Should Know

What is a "Data Pipeline"? +

Imagine water flowing from a dirty river to your kitchen sink. It has to go through pipes and filters to become clean. A Data Pipeline is a set of Python codes we write that takes messy data (like a messy Excel sheet with missing names and wrong numbers), filters out the bad stuff, and delivers perfectly clean data to our AI.

What does "Training" a model mean? +

If you want to teach a toddler what a "cat" is, you show them 100 pictures of cats. Eventually, they learn the pattern (pointy ears, whiskers). Training is when we show our computer thousands of rows of data so it can find the mathematical patterns on its own.

The Toolbox

Your First AI Software Kit

You don't need fancy computers to start. Here are the free tools we will use in this course.

๐Ÿ““

Google Colab

Think of it as "Google Docs for Code". It lets you write Python in your browser for free. No setup required!

Open Colab โ†—
๐Ÿผ

Pandas Library

The "Excel of Python". It allows you to open huge files and find averages, sums, and patterns in one line of code.

๐Ÿ“‰

Matplotlib

The "Artist" tool. It takes your dry numbers and turns them into beautiful bar charts, line graphs, and pie charts.

1. The print() Function

What it does: Makes the computer talk back to you by displaying text on the screen.

print("Hello World!")
print(5 + 5) # Prints 10

2. The input() Function

What it does: Pauses the program and waits for the human to type an answer.

name = input("Your name? ")
print("Nice to meet you", name)

3. Data Types (Strings vs Integers)

What it does: Python needs to know if data is a word (String) or a number (Integer).

word = "Apple"  # String
age = 10        # Integer
price = 5.99    # Float

4. The type() Function

What it does: Sometimes you forget what kind of data is in a box. This asks the computer to check for you!

mystery = 3.14
print(type(mystery)) # class 'float'

5. Indentation (Tabs)

What it does: In Python, you CANNOT put spaces anywhere. Code inside an If-statement MUST be pushed in (indented).

if 5 > 2:
    print("Five is bigger!") # Tabbed!

6. Comments (#)

What it does: Any line that starts with a hashtag is ignored. We use it to leave notes for humans!

# The computer ignores this.
print("But it WILL read this!")

7. Lists [ ]

What it does: Stores multiple values โ€” like a shopping list for the computer!

fruits = ["Mango","Apple","Guava"]
print(fruits[0])   # Mango
fruits.append("Banana")
print(len(fruits)) # 4

8. For Loops

What it does: Repeats an action for every item in a list automatically!

students = ["Priya","Aryan","Zara"]
for s in students:
    print("Welcome,", s)

9. def Functions

What it does: A reusable block of code โ€” write once, call many times!

def greet(name, age):
    print(f"Hi {name}, age {age}!")
greet("Priya", 14)
greet("Aryan", 15)

10. Dictionaries { }

What it does: Stores key-value pairs โ€” like a real dictionary!

student = {"name":"Priya","marks":92}
print(student["name"]) # Priya

11. f-Strings

What it does: The cleanest way to embed variables inside text!

name = "Zara"; score = 98
print(f"{name} scored {score}%!")

12. Try / Except

What it does: Catches crashes before they happen โ€” essential for real code!

try:
    age = int(input("Your age? "))
    print(f"In 10 years: {age+10}")
except ValueError:
    print("Please type a number!")

๐Ÿš€ Advanced Pre-ML Skills

Master these four topics before diving into Machine Learning

List Comprehension โ€” Python in One Line โœจ +

Create a new list in one elegant line. Data Scientists use this constantly to transform huge datasets instantly.

# Normal way (3 lines)
squares = []
for n in range(1, 6):
    squares.append(n * n)

# Pythonic way (1 line!)
squares = [n*n for n in range(1, 6)]
print(squares)  # [1, 4, 9, 16, 25]

# Real AI use: normalize pixel values to 0โ€“1
pixels = [128, 255, 64, 0]
normalized = [p / 255 for p in pixels]
print(normalized)  # [0.50, 1.0, 0.25, 0.0]
NumPy โ€” The Math Engine of All AI ๐Ÿงฎ +

NumPy is the backbone of PyTorch, Pandas, and Scikit-Learn. It performs matrix maths 50ร— faster than regular Python lists.

import numpy as np

matrix = np.array([[1, 2, 3], [4, 5, 6]])
print("Shape:", matrix.shape)  # (2, 3)
print("Mean:",  matrix.mean()) # 3.5

# How a neuron calculates its output (Dot Product)
weights = np.array([0.2, 0.5, 0.3])
inputs  = np.array([0.9, 0.1, 0.8])
neuron  = np.dot(weights, inputs)
print("Neuron output:", round(neuron, 3))
OOP Classes โ€” Blueprint for Neural Networks ๐Ÿ—๏ธ +

In PyTorch, you define your entire Neural Network as a Class inheriting from nn.Module. Understanding Classes is non-negotiable for deep learning.

class StudentAI:
    def __init__(self, name, accuracy):
        self.name = name
        self.accuracy = accuracy

    def describe(self):
        print(f"{self.name} โ†’ {self.accuracy}%")

    def retrain(self, boost):
        self.accuracy = min(100, self.accuracy + boost)
        print(f"Retrained! Now {self.accuracy}%")

v1 = StudentAI("Remesys-v1", 72)
v2 = StudentAI("Remesys-v2", 88)
v1.describe()   # Remesys-v1 โ†’ 72%
v2.retrain(9)   # Retrained! Now 97%
File I/O โ€” Reading Real Datasets ๐Ÿ“‚ +

Real AI projects load data from CSV, JSON, and text files. Master this and you can process any dataset the industry gives you.

import json, csv

# Save AI config as JSON
config = {"model":"Remesys-v2","lr":0.001,"epochs":50}
with open("config.json","w") as f:
    json.dump(config, f, indent=2)

# Load it back
with open("config.json","r") as f:
    data = json.load(f)
print(f"Model: {data['model']}, LR: {data['lr']}")

# Read a CSV file row by row
with open("students.csv","r") as f:
    reader = csv.DictReader(f)
    for row in reader:
        print(row["name"], "โ†’", row["marks"])
Interactive Fun

The AI Playground (Try it!)

Learning should feel like a game! We've integrated amazing Javascript libraries so you can build, run, and test Python and AI directly in your browser without installing anything.

Drag & Drop Programming

Before typing code, you can build logic by snapping blocks together! We use Google Blockly to let you drag "If-Statements" and "Loops" like Lego bricks.

When you build the blocks, the tool automatically translates it into real Python code for you to read.

๐Ÿงฉ Interactive Blockly Workspace

# Auto-generated Python will appear here...

Run Real Python in your Browser

No need to install complicated software. We use Pyodide (Python compiled to WebAssembly) to let you write and test Python directly on this website.

Type your math or data scripts below and hit the green "Run" button to see the magic happen instantly.

๐Ÿ’ป Browser Python Terminal

main.py
> System: Python Engine Loading... (This may take a moment)

Train AI with your Webcam!

AI isn't just text. Using ml5.js and p5.js, we access your webcam securely in the browser to run real machine learning models.

You can play games where the AI tracks your hands, recognizes your face, or tries to guess what object you are holding to the camera.

๐Ÿ“ท Object Detection Simulator

๐Ÿ“ฑ

How ChatGPT Remembers

Have you ever wondered how ChatGPT remembers what you said 5 minutes ago? It doesn't actually have a human brain! It uses a simple Python List of Dictionaries called a Message Array.

Every time you send a message, the program appends it to a list. Type a message below to see exactly what the raw JSON array looks like under the hood before it gets sent to the server!

๐Ÿง  Chat History Array Simulator

[
  {
    "role": "system",
    "content": "You are a helpful assistant."
  }
]

Data Visualizer Sandbox

Data Scientists don't just look at boring spreadsheets all day. They use Python libraries like Matplotlib to turn raw numbers into beautiful graphs and charts!

Type some comma-separated numbers in the box below and click "Draw Graph" to see how raw data gets instantly translated into visual insights.

๐Ÿ“Š Live Bar Chart

Section C

The 3-Month Junior Curriculum

Step-by-step, simple, and extremely fun. You will write code every single week.

W0
Module 0: The NCERT & IB Foundation

What is AI? (And what is NOT?)

Aligned with the NCERT (India) and IB (International) elementary curriculum, we start by understanding what makes a machine "intelligent." Not every robot is AI. If a machine follows strict rules (like a calculator), it's not AI. If it learns from data (like YouTube recommending videos), it IS AI!

Lesson 1: The 3 Domains of AI +

AI is generally divided into three major sensory domains:

  • Data Sciences: AI that looks at numbers (e.g., predicting weather, pricing houses).
  • Computer Vision: AI that looks at pictures (e.g., Face ID, Self-driving cars).
  • Natural Language Processing (NLP): AI that reads and speaks text (e.g., Siri, Alexa, ChatGPT).
Lesson 2: AI & Sustainable Development Goals (SDGs) +

The United Nations created 17 SDGs to help save the planet by 2030. In this curriculum, we learn how AI can solve real-world problems. For example:

  • SDG 3 (Good Health): AI detecting diseases from X-rays.
  • SDG 13 (Climate Action): AI predicting forest fires before they spread.
  • SDG 4 (Quality Education): AI tutoring apps (like this one!) helping students learn faster.
M1
Module 1: The Python Playground

Learning the Language of AI

Before we can do AI, we need to know how to talk to the computer. Python is the easiest language to learn. We will learn how to store information and make the computer do math for us.

๐Ÿ› ๏ธ Tools to Practice (Module 1)

  • Replit.com: A free website where you can write and run Python code right in your browser. No downloading needed! Perfect for beginners.
  • Python IDLE: If you want to download Python to your computer, download it from Python.org. It comes with "IDLE", a simple notepad where you can write code.
  • Python Turtle: A fun library built into Python that lets you draw shapes by writing code. It bridges the gap between block-coding (like Scratch) and typed code!
Lesson 1: Variables (Boxes of Data) & Printing +

Imagine you have a cardboard box. You write "Player Name" on the outside of the box, and inside you put a piece of paper that says "Alex". In Python, this box is called a Variable.

Step 1: Creating the Box

player_name = "Alex"  # The quotes mean it is text (a String)
player_score = 50     # No quotes means it is a number (an Integer)

Step 2: Doing Math

bonus_points = 25
total_score = player_score + bonus_points  # Python does 50 + 25 automatically!

Step 3: Talking to the Computer

We use the print() command to make the computer speak the answer back to us.

print("Hello", player_name)
print("Your total score is:", total_score)

โœ‹ Hands-On Practice: Your Turn!

Open Replit.com and try this exact mission:

  1. Create a variable called my_favorite_food and set it to your favorite food.
  2. Create a variable called food_price and set it to 10.
  3. Print out a sentence that says: "My favorite food is [food] and it costs [price]."

๐Ÿ’ก Hint: Type print("My favorite food is", my_favorite_food)

Lesson 2: Lists (Backpacks for Data) +

What if you want to store 5 friends' names? Creating 5 separate variables (friend1, friend2) is boring. We use a List (like a backpack) to hold many items at once in a single variable.

Step 1: Packing the Backpack

We use square brackets [] to create a list.

my_friends = ["Sarah", "John", "Mike", "Emma"]

Step 2: Pulling items out of the Backpack

Computers are weird. They start counting at 0, not 1!

print("My first friend is:", my_friends[0]) # Prints Sarah!
print("My second friend is:", my_friends[1]) # Prints John!

Step 3: Adding to the Backpack

Use the magic word .append() to add something new.

my_friends.append("Leo")
print("I now have", len(my_friends), "friends!") # len() tells us how many items!

โœ‹ Hands-On Practice: The Shopping List

  1. Create a list called shopping_list and put 3 items in it (e.g., "Apples", "Milk", "Bread").
  2. Print out the VERY FIRST item in your list using [0].
  3. Use .append() to add "Cookies" to your list, and print the whole list!
Lesson 3: If/Else (Making Decisions) and Loops +

We want our computer to make decisions (If this happens, do that). A Loop lets us repeat code over and over without typing it a million times. It's like telling the computer "Do this 100 times!"

Making Decisions (If / Else)

temperature = 30

if temperature > 25:
    print("It's hot outside! Eat ice cream.")
else:
    print("It's cold. Wear a jacket.")

The Magic Loop (For Loops)

Let's combine our Backpack (List) with a Loop. This code automatically says hello to every friend in the backpack, one by one!

my_friends = ["Sarah", "John", "Mike"]

for friend in my_friends:
    print("Hello,", friend, "! Let's learn AI!")

โœ‹ Hands-On Practice: The Game Over Screen

  1. Create a variable called player_lives and set it to 0.
  2. Write an if statement: If player_lives is equal to 0 (use ==), print "Game Over!".
  3. Write an else statement: Otherwise, print "Keep Playing!".
Fun Project 1: The Smart Tip Calculator

Task: Build a Python program that asks the user how much their restaurant bill was, asks what percentage tip they want to leave, and calculates the total cost.

Project Execution: Step-by-Step Code +

Step 1: Get User Input
We use input() to ask the user a question, and float() to make sure the computer treats their answer like a number with decimals.

print("Welcome to the Tip Calculator!")
bill = float(input("What was the total bill? $"))
tip_percent = float(input("What percentage tip would you like to give? (10, 15, 20): "))

Step 2: The Math Pipeline
Calculate the actual tip amount, and add it to the bill.

# If bill is 100 and tip is 15, then 100 * (15 / 100) = 15
tip_amount = bill * (tip_percent / 100)
final_total = bill + tip_amount

# Round it to 2 decimal places so it looks like real money
final_total = round(final_total, 2)
print("You need to pay a total of: $", final_total)
M2
Module 2: The Data Detective

Pandas and Data Pipelines

Now that we know Python, let's use it on real data. Data in the real world is messy. We will learn a tool called Pandas, which is like Excel but with super coding powers.

๐Ÿ› ๏ธ Tools to Practice (Month 2)

  • Google Sheets & Forms: Before using Pandas, create a Google Form and send it to your class to collect real data. See how it looks in rows and columns in Google Sheets.
  • Google Colab: Go to colab.research.google.com. It's a free online notebook where Pandas is already installed! You can upload Excel or CSV files right into it.
  • Kaggle Datasets: Go to Kaggle.com/datasets and search for "Pokemon" or "Superheroes". Download the CSV files to practice analyzing fun data.
  • Matplotlib & Seaborn: These are Python tools we will use to draw colorful bar charts and graphs.
Lesson 1: Loading Data with Pandas +

Data in the real world is stored in tables (like Excel). But Excel is slow. We use a Python tool called Pandas to load millions of rows of data instantly! A table of data in Pandas is called a DataFrame.

Step 1: Import the Tool

Before we use Pandas, we have to invite it to our code using import.

import pandas as pd

Step 2: Load the File

CSV means "Comma Separated Values". It's just a simple text file holding our table data.

# Load the file into a DataFrame box called 'df'
df = pd.read_csv("superheroes.csv")

Step 3: Look at the Data

# .head() looks at the very top 5 rows
print(df.head(5))

# .shape tells us (Rows, Columns)
print("Rows and Columns:", df.shape)

โœ‹ Hands-On Practice: Your First Dataset

Open Google Colab (colab.research.google.com) and try this:

  1. Type import pandas as pd in the first cell and run it.
  2. Google Colab has a built-in file called 'california_housing_train.csv' in the 'sample_data' folder!
  3. Load it: my_data = pd.read_csv("sample_data/california_housing_train.csv")
  4. Print the first 10 rows using print(my_data.head(10))!
Lesson 2: Filtering and Asking Questions +

Imagine having a list of 10,000 superheroes, but you only want to see the ones who can fly. In Python, we can filter our DataFrame just like a detective finding specific clues.

Filtering by Yes/No (Booleans)

We put the condition inside the square brackets [].

# Find only the superheroes who can fly
flying_heroes = df[df['Can_Fly'] == True]
print("Number of flying heroes:", len(flying_heroes))

Filtering by Numbers

We use math symbols like > (Greater Than) or < (Less Than).

# Find heroes with power level over 9000
super_strong = df[df['Power_Level'] > 9000]
print(super_strong['Name'])

โœ‹ Hands-On Practice: The Gotham Detective

  1. Imagine you have a superhero dataframe called df.
  2. Write the exact code to filter and find all superheroes whose 'City' is exactly equal to 'Gotham'.
  3. Save it in a variable called gotham_heroes.

๐Ÿ’ก Hint: Use df[df['City'] == "Gotham"]. Notice we use double equals == to check if something is equal!

Lesson 3: Cleaning the Mess! +

Sometimes data has blank spots (NaN - Not a Number). If we feed blank data to an AI, it crashes! We must fill in the blanks or delete them.

# Oh no! Some superheroes are missing their "Power Level" in the file.
# Let's build a pipeline to fix the missing data:
df['Power_Level'] = df['Power_Level'].fillna(50) # Give them a default of 50

# What if their name is missing? Let's drop those rows completely.
df = df.dropna(subset=['Name'])
Lesson 4: Drawing Charts with Matplotlib +

Numbers alone are hard to understand. But a graph tells the story instantly! We use Matplotlib to draw beautiful charts with just a few lines of Python code. This is exactly what Data Scientists do in top companies like Google and Netflix.

Drawing a Line Graph (Trend over time)

import matplotlib.pyplot as plt

# Monthly Sales data for a small shop
months = ['Jan', 'Feb', 'Mar', 'Apr', 'May']
sales  = [1200,  1800,  1500,  2300,  2100]

plt.plot(months, sales, color='cyan', marker='o', linewidth=2)
plt.title("Monthly Sales Trend")
plt.ylabel("Sales (โ‚น)")
plt.xlabel("Month")
plt.grid(True, alpha=0.3)
plt.show()

Drawing a Pie Chart

# Favourite sports survey at school
sports  = ['Cricket', 'Football', 'Badminton', 'Chess']
votes   = [45, 30, 15, 10]
colors  = ['#f43f5e','#38bdf8','#34d399','#fbbf24']

plt.pie(votes, labels=sports, colors=colors, autopct='%1.0f%%')
plt.title("Most Popular Sport in Our Class")
plt.show()

โœ‹ NCERT Hands-On: Class Survey Analyzer

  1. Survey your classmates: ask them their favourite subject (Maths, Science, English, Hindi).
  2. Enter the counts as a Python list.
  3. Draw a Pie Chart showing the results!
Lesson 5: Descriptive Statistics โ€” Mean, Median, Mode +

These three words come from your Class 7 Maths textbook (NCERT Chapter โ€” Data Handling). AI uses them every single day to summarize huge datasets in one number.

import pandas as pd

marks = pd.Series([72, 85, 90, 85, 60, 72, 99, 85, 40, 72])

print("Mean (Average):", marks.mean())    # (72+85+...)/10
print("Median (Middle):", marks.median()) # Sort then pick centre
print("Mode (Most Common):", marks.mode()[0]) # Which number appears most?
print("Std Dev (Spread):", round(marks.std(), 2))  # How spread-out is the data?

๐Ÿง  Real-World Use: When Netflix says "Users rated this film 4.5 stars", that 4.5 is the Mean of millions of individual ratings โ€” calculated instantly using this exact technique!

๐Ÿงฉ Month 2 Quick Quiz โ€” Test Your Knowledge!

Q1. In Pandas, what does df.head(5) do?

Q2. Which symbol checks if two values are equal in Python?

Q3. What does df.dropna() do?

๐ŸŒŸ Fun Fact & Modern Research

Did you know? In 2024, researchers from Stanford proved that you don't actually need perfectly clean data to train certain AI models! A modern technique called "Instruction Tuning" allows AI (like Llama 3) to learn from messy data as long as there is a strong "System Prompt" guiding it. However, for structured tables like Pokemon stats, Pandas is still the absolute king of the industry!

Fun Project 2: Pokemon Stat Analyzer

Task: Download a real CSV file of 800+ Pokemon. Use Python to clean the data, find the average HP, and draw a bar chart showing which Pokemon Type (Fire, Water, Grass) is the strongest overall.

Project Execution: Step-by-Step Code +

Step 1: Load and Analyze
Bring the data into Python using Pandas.

import pandas as pd

pokemon_data = pd.read_csv("pokemon.csv")
print("Total Pokemon:", len(pokemon_data))

# Find the average HP of all Pokemon
average_hp = pokemon_data['HP'].mean()
print("Average HP is:", round(average_hp, 2))

Step 2: Drawing the Chart
We will use a library called Matplotlib to turn our data numbers into a colorful picture.

import matplotlib.pyplot as plt

# Group the Pokemon by their Type (Water, Fire, etc.) and get their average Attack
type_stats = pokemon_data.groupby('Type 1')['Attack'].mean()

# Draw a bar chart!
type_stats.plot(kind='bar', color='orange')
plt.title("Average Attack by Pokemon Type")
plt.ylabel("Attack Power")
plt.xlabel("Pokemon Type")
plt.show() # This makes the chart appear on the screen!
M3
Module 3: Junior AI Builder

Machine Learning Basics

This is where the magic happens. We will use the clean data from Month 2 to teach the computer how to predict things it has never seen before!

๐Ÿ› ๏ธ Tools to Practice (Month 3)

  • Google Teachable Machine: Go to teachablemachine.withgoogle.com. Before writing code, use your webcam to train a mini-AI to recognize your face vs your dog. It teaches you how "training" works visually.
  • Scikit-Learn (sklearn): The best Python library for beginner Machine Learning. It has all the algorithms built-in so you don't have to do advanced math!
  • Streamlit: A magical Python tool that turns your machine learning script into a real, clickable website in just 5 lines of code!
Lesson 1: No-Code AI (Teachable Machine) +

Before coding, we must understand what Training means visually. AI is just learning patterns from lots of examples.

Step 1: Go to Google Teachable Machine

Open your browser and search for "Google Teachable Machine". Click "Get Started" and choose "Image Project".

Step 2: Collect the Data (The Ingredients)

Rename Class 1 to "Rock". Turn on your webcam and hold down the button to take 100 pictures of your hand making a Rock. Do the same for "Paper" and "Scissors" in other classes.

Step 3: Train the AI (The Oven)

Click the big "Train Model" button. Wait 30 seconds. The computer is analyzing the pixels in your 300 pictures to find the math patterns of what a "Rock" looks like versus "Scissors".

โœ‹ Hands-On Practice: Test the AI

Now that the model is trained, hold up a Rock to the webcam. Does the output bar at the bottom correctly say "Rock - 100%"? You just built a Computer Vision AI without writing a single line of code! This is exactly what our Python code will do with numbers.

Lesson 2: Guessing Numbers (Linear Regression) +

If we want to guess a number (like "How much ice cream will sell today based on the temperature?"), we use an algorithm called Linear Regression. It looks at historical data points and draws a straight line through them to guess the future.

Step 1: The Historical Data

X is the Feature (Temperature in degrees). y is the Target (How many ice creams we sold).

from sklearn.linear_model import LinearRegression

# We must use double brackets for X!
X = [[20], [25], [30], [35], [40]] 
y = [50, 100, 150, 200, 250]

Step 2: Train & Predict

model = LinearRegression()

# Teach the computer! (It realizes: hotter = more sales)
model.fit(X, y) 

# Predict! What if tomorrow is 32 degrees?
guess = model.predict([[32]])
print("At 32 degrees, we will sell exactly:", guess[0], "ice creams.")

โœ‹ Hands-On Practice: The Winter Prediction

  1. Copy the code above into Replit or Colab.
  2. Change the prediction temperature from 32 to 5 (a freezing winter day!).
  3. Run the code. Does the AI predict we will sell a lot of ice cream, or almost none? Let the AI do the math!
Lesson 3: Grouping Things (Classification) +

If we want to guess a category (like "Is this email spam or not spam?"), we use Classification. It looks at the features of an object and draws a boundary line between different groups.

Step 1: The Historical Data

Let's predict if an animal is a Dog or a Cat. X is our data: [Weight in lbs, Height in inches].

from sklearn.tree import DecisionTreeClassifier

X = [[50, 24], [5, 10], [60, 26], [8, 12]]
y = ["Dog", "Cat", "Dog", "Cat"] # The Answers!

Step 2: Train & Predict

brain = DecisionTreeClassifier()

# Teach the computer the difference between Dogs and Cats
brain.fit(X, y)

# Predict! What is a mystery animal that weighs 10 lbs and is 11 inches tall?
mystery_animal = brain.predict([[10, 11]])
print("The AI says this animal is a:", mystery_animal[0])

โœ‹ Hands-On Practice: The Pet Detective

  1. Copy the code above into Replit or Colab.
  2. Change the mystery animal's weight to 70 and height to 30.
  3. Run the code. Does the AI predict a Dog or a Cat?

๐Ÿ’ก Hint: Big numbers will make the AI lean towards Dog because of the historical data we gave it!

Fun Project 3: The Movie Recommender

Task: Build a simple AI that asks the user what kind of movies they like (Action or Comedy) and their age. The computer will use a Decision Tree (Classification) to recommend the perfect movie.

Project Execution: Step-by-Step Code +

Step 1: The Training Data
First, we give the computer some examples. For our data, let's say [Age, Genre]. Let Genre 0 = Comedy, 1 = Action.

from sklearn.tree import DecisionTreeClassifier

# X is our training data: [Age, Genre]
# y is the movie they liked
X_train = [
    [10, 0], [12, 0], # Kids who like comedy
    [25, 1], [30, 1], # Adults who like action
    [15, 1], [40, 0]  # Teen action, Adult comedy
]
y_movies = [
    "Minions", "Toy Story", 
    "The Matrix", "John Wick", 
    "Spider-Man", "Mr. Bean"
]

Step 2: Train and Predict
We train a Decision Tree algorithm to learn who likes what.

# Create the AI brain
ai_brain = DecisionTreeClassifier()

# Teach it! (Training)
ai_brain.fit(X_train, y_movies)

# Now let's ask the user!
user_age = int(input("How old are you? "))
user_genre = int(input("Type 0 for Comedy, or 1 for Action: "))

# The AI makes a guess based on what it learned
recommendation = ai_brain.predict([[user_age, user_genre]])
print("You should watch:", recommendation[0])

๐Ÿงฉ Month 3 Quiz โ€” Machine Learning Checkpoint

Q1. What is the "training" step in Machine Learning?

Q2. Which Python library is used for beginner Machine Learning?

Q3. "Classification" AI is used to...

M4
Month 4 (Bonus): AI Ethics & Deepfakes

With Great Power Comes Great Responsibility

Now that you can build AI models, we must learn responsibility. This module is directly aligned with NCERT Class 9 Social Science (Rights and Duties) and the IB Learner Profile (Caring, Reflective). Every powerful engineer must also be an ethical one.

Lesson 1: What is a Deepfake? +

A Deepfake is when AI is used to swap one person's face onto another body in a video, or to clone someone's voice. They are created using a type of AI called a GAN (Generative Adversarial Network) โ€” two AIs competing against each other, one creating fakes and one trying to detect them.

๐Ÿ” How to Spot a Deepfake (Checklist)

  • ๐Ÿ‘๏ธ Blinking: Early deepfakes blinked unnaturally or never blinked.
  • โœ‹ Hands: AI still struggles with fingers โ€” look for 6 fingers or fused hands.
  • ๐Ÿ‘‚ Ears & Jewellery: Often look blurry or asymmetrical.
  • ๐Ÿ’ก Background text: AI cannot consistently generate readable text in images.
Lesson 2: AI Bias โ€” When the Data is Unfair +

AI learns from historical data. But history is not always fair. If we train a hiring AI on 20 years of data where only men were hired for engineering jobs, the AI will learn to reject women. This is called Algorithmic Bias. It is one of the most important problems in modern AI.

๐Ÿ“ฐ Real Case (2018): Amazon built an AI resume screener and had to shut it down because it was automatically downgrading CVs that contained the word "women's" (as in "Captain of Women's Chess Club"). The AI had learned from 10 years of predominantly male hires.

Lesson 3: India's Approach to AI Regulation +

India's National Strategy for AI (NITI Aayog) identifies 5 key sectors where AI should be used responsibly: Healthcare, Agriculture, Education, Smart Cities, and Smart Mobility. The framework insists on "AI for All" โ€” ensuring AI benefits everyone in India, not just the wealthy.

๐Ÿงฉ Ethics Quiz โ€” Bonus Module

Q1. A Deepfake is generated using which type of AI?

Q2. Algorithmic Bias happens when...

Build Real Stuff

5 Hands-On Real-World Projects

Don't just practice on textbooks. These projects are modelled after real AI apps used by millions of people worldwide. Each one goes into your portfolio!

๐Ÿฉบ

Project 1: Disease Symptom Checker

SDG 3 โ€” Good Health | Difficulty: โญโญ

Build an AI that asks a user for symptoms and predicts whether they might have Diabetes or be Healthy. Uses the real PIMA Indian Diabetes Dataset from Kaggle (768 real patients).

๐Ÿ› ๏ธ Tech Stack

Pandas Scikit-Learn Random Forest Streamlit
View Full Project Code +
import pandas as pd
from sklearn.ensemble import RandomForestClassifier
from sklearn.model_selection import train_test_split
from sklearn.metrics import accuracy_score
import streamlit as st

# Load real patient data from Kaggle
df = pd.read_csv("diabetes.csv")

# Prepare features and label
X = df[['Glucose','BloodPressure','BMI','Age']]
y = df['Outcome']  # 1=Diabetic, 0=Healthy

# Split and train
X_train, X_test, y_train, y_test = train_test_split(X, y, test_size=0.2)
model = RandomForestClassifier(n_estimators=100)
model.fit(X_train, y_train)
print(f"Accuracy: {accuracy_score(y_test, model.predict(X_test))*100:.1f}%")

# --- Streamlit Web App ---
st.title("๐Ÿฉบ Diabetes Risk Checker")
glucose = st.slider("Glucose Level", 0, 200, 120)
bp      = st.slider("Blood Pressure", 0, 130, 70)
bmi     = st.slider("BMI", 10.0, 60.0, 25.0)
age     = st.slider("Age", 10, 80, 30)

if st.button("Check Risk"):
    pred = model.predict([[glucose, bp, bmi, age]])
    st.success("โœ… Low Risk" if pred[0]==0 else "โš ๏ธ High Risk โ€” consult a doctor")
๐ŸŒŸ Fun Fact: The PIMA Indian Diabetes Dataset was collected by the US National Institute of Diabetes (NIH) in 1988. Today, similar AI models are deployed in hospitals across 40+ countries to flag high-risk patients before symptoms worsen!
๐Ÿ 

Project 2: House Price Predictor

Linear Regression | Difficulty: โญโญ

Build an AI that predicts the price of a house based on its size, location, and number of rooms. This is the same type of model used by Zillow, MagicBricks, and NoBroker!

๐Ÿ› ๏ธ Tech Stack

Pandas Linear Regression Matplotlib
View Full Project Code +
import pandas as pd
import matplotlib.pyplot as plt
from sklearn.linear_model import LinearRegression
from sklearn.metrics import mean_absolute_error

# Sample data: [Size sqft, Bedrooms, Age of house] โ†’ Price (Lakhs โ‚น)
data = {
    'size':    [800, 1200, 1500, 2000, 800,  1000, 2500, 1800],
    'rooms':   [2,   3,    3,    4,    1,    2,    5,    4],
    'age':     [5,   10,   2,    15,   20,   8,    1,    12],
    'price':   [45,  75,   90,   140,  32,   60,   185,  115]
}
df = pd.DataFrame(data)

X = df[['size', 'rooms', 'age']]
y = df['price']

model = LinearRegression()
model.fit(X, y)

# Predict price for a new 1600sqft, 3-bedroom, 5yr-old house
prediction = model.predict([[1600, 3, 5]])
print(f"Predicted price: โ‚น{prediction[0]:.1f} Lakhs")

# Show feature importance
for feature, coef in zip(X.columns, model.coef_):
    print(f"{feature}: โ‚น{coef:.2f} Lakhs per unit")
๐Ÿ˜Š

Project 3: WhatsApp Sentiment Analyzer

NLP | Difficulty: โญโญโญ

Export your WhatsApp chat history and use Python to analyze who sends the most positive messages! Uses VADER Sentiment Analysis โ€” the same NLP tool used by Twitter/X to detect toxic tweets.

View Full Project Code +
from vaderSentiment.vaderSentiment import SentimentIntensityAnalyzer
import pandas as pd, matplotlib.pyplot as plt

# Install first: pip install vaderSentiment
analyzer = SentimentIntensityAnalyzer()

messages = [
    {"sender": "Priya", "text": "I love this project! So much fun ๐Ÿ˜"},
    {"sender": "Aryan", "text": "This is boring and too hard"},
    {"sender": "Priya", "text": "We can do it! Let's go! ๐Ÿ’ช"},
    {"sender": "Aryan", "text": "Fine, you're right. It's actually interesting."},
    {"sender": "Zara",  "text": "Amazing results! Best project ever!"},
]

results = []
for msg in messages:
    score = analyzer.polarity_scores(msg['text'])
    results.append({'sender': msg['sender'],
                    'text': msg['text'][:30],
                    'compound': score['compound']})

df = pd.DataFrame(results)
avg_by_person = df.groupby('sender')['compound'].mean()
print("Positivity by person:
", avg_by_person.round(2))

# Plot
avg_by_person.plot(kind='bar', color=['#34d399','#38bdf8','#f43f5e'], title='Who is the most positive?')
plt.ylabel("Sentiment Score (-1 to +1)")
plt.show()
๐ŸŒพ

Project 4: Crop Yield Predictor (NCERT SDG 2)

SDG 2 โ€” Zero Hunger | Difficulty: โญโญโญ

Build an AI that predicts which crop a farmer should plant based on soil nitrogen, phosphorus, rainfall, and temperature. Aligned with NCERT Class 8 Agriculture chapter and India's Kisan AI initiative.

View Full Project Code +
import pandas as pd
from sklearn.tree import DecisionTreeClassifier
from sklearn.model_selection import train_test_split

# Real dataset: Crop Recommendation Dataset (Kaggle)
# Features: Nitrogen, Phosphorus, Potassium, Temp, Humidity, pH, Rainfall
df = pd.read_csv("Crop_recommendation.csv")

X = df[['N','P','K','temperature','humidity','ph','rainfall']]
y = df['label']  # e.g., 'rice', 'wheat', 'mango'

X_train, X_test, y_train, y_test = train_test_split(X, y, test_size=0.2, random_state=42)

model = DecisionTreeClassifier(max_depth=10)
model.fit(X_train, y_train)
print(f"Accuracy: {model.score(X_test, y_test)*100:.1f}%")

# Predict for a farmer's specific soil conditions
farmer_soil = [[90, 42, 43, 20.8, 82.0, 6.5, 202.9]]
recommendation = model.predict(farmer_soil)
print(f"๐ŸŒพ Plant: {recommendation[0].upper()}")
๐ŸŒŸ Fun Fact: India's Pradhan Mantri Fasal Bima Yojana (crop insurance scheme) is now exploring AI models exactly like this one to assess crop damage via satellite imagery โ€” reducing fraud and speeding up insurance payments for 5 crore farmers!
๐Ÿ“ฐ

Project 5: Fake News Detector

NLP + Classification | Difficulty: โญโญโญโญ

Build a tool that reads a news headline and classifies it as Real or Fake. Uses TF-IDF vectorization and a Naive Bayes classifier โ€” the same core approach used by Meta, Twitter/X, and WhatsApp to combat misinformation.

View Full Project Code +
import pandas as pd
from sklearn.feature_extraction.text import TfidfVectorizer
from sklearn.naive_bayes import MultinomialNB
from sklearn.model_selection import train_test_split
from sklearn.metrics import classification_report

# Load dataset (fake-news dataset from Kaggle)
real = pd.read_csv("True.csv"); real["label"] = 1
fake = pd.read_csv("Fake.csv"); fake["label"] = 0
df = pd.concat([real, fake]).sample(frac=1).reset_index(drop=True)

X = df["title"]   # Just the headline text
y = df["label"]   # 1 = Real, 0 = Fake

X_train, X_test, y_train, y_test = train_test_split(X, y, test_size=0.2)

# TF-IDF: converts words into numbers (how important is each word?)
vectorizer = TfidfVectorizer(max_features=5000, stop_words='english')
X_train_vec = vectorizer.fit_transform(X_train)
X_test_vec  = vectorizer.transform(X_test)

model = MultinomialNB()
model.fit(X_train_vec, y_train)
print(classification_report(y_test, model.predict(X_test_vec)))

# Test on your own headline!
test_headline = ["Scientists discover water on Mars โ€” NASA confirms"]
vec = vectorizer.transform(test_headline)
pred = model.predict(vec)
print("Real โœ…" if pred[0] == 1 else "Fake โŒ")

๐ŸŒŸ Amazing AI Fun Facts

๐Ÿค–

GPT-4 was trained on ~1 trillion tokens of text โ€” roughly equivalent to reading every Wikipedia article 5,000 times over!

๐Ÿง 

Your human brain has ~86 billion neurons. The largest AI model (Grok-1) has ~314 billion parameters. AI is catching up!

โšก

A single NVIDIA H100 GPU can perform 4,000 trillion calculations per second โ€” more than every human on Earth calculating simultaneously!

๐Ÿ‡ฎ๐Ÿ‡ณ

India produces the 2nd largest number of AI researchers in the world, after the USA. Cities like Bangalore and Hyderabad are the AI capitals of Asia!

๐Ÿ“Š

By 2030, AI is expected to add $15.7 trillion to the global economy โ€” more than the current GDP of China and India combined!

๐ŸŽฎ

AlphaGo (2016) beat the world Go champion 4-1. The game has more possible moves than atoms in the observable universe. Pure AI vs 3000 years of human strategy!